Introduction
This article is created to help those technical newbies who want to learn creation of OLAP Cube in SSAS (SQL Server Analysis Services) using Microsoft BIDS (Business Intelligence Development Studio) Environment and Data Warehouse. We will first take a glimpse at the basic introduction to requirement of OLAP Cube, and then create OLAP Cube in SQL Server Analysis Service by following 10 easy steps.
Brief Introduction to OLAP Cube
What is OLAP Cube & Why do we need it?
- An OLAP cube is a technology that stores data in an optimized way to provide a quick response to various types of complex queries by using dimensions and measures.
Most cubes store pre-aggregates of the measures with its special storage structure to provide quick response to queries. - SSRS Reports and Excel Power Pivot is used as front end for Reporting and data analysis with SSAS (SQL Server Analysis Services) OLAP Cube.
- SSAS (SQL Server Analysis Services) is Microsoft BI Tool for creating Online Analytical Processing and data mining functionality.
- BIDS (Business Intelligence Development Studio) provides environment for developing your OLAP Cube and Deploy on SQL Server.
- BIDS (Business Intelligence Development Studio) comes with Microsoft SQL Server 2005, 2008 (e.g. Developer, Enterprise Edition) .
- We have to choose OLAP Cube when performance is a key factor, the key decision makers of the company can ask for statistics from the data anytime from your huge database.
- We can perform various types of analysis on data stored in Cube, it is also possible to create data mining structure on this data which can be helpful in forecasting, prediction.
What is the difference between OLAP and OLTP?
| Online Transaction Processing (OLTP) | Online Analytical Processing (OLAP) |
| Designed to support Daily DML Operations of your application | Designed to hold historical data for analyses and forecast business needs |
| Holds daily Latest Transactional Data related to your application | Data is consistent up to the last update that occurred in your Cube |
| Data stored in normalized format | Data stored in denormalized format |
| Databases size is usually around 100 MB to 100 GB | Databases size is usually around 100 GB to a few TB |
| Used by normal users | Used by users who are associated with the decision making process, e.g., Managers, CEO. |
| CPU, RAM, HDD space requirement is less. | CPU, RAM, HDD space requirement is higher. |
| Query response may be slower if the amount of data is very large, it can impact the reporting performance. | Query Response is quicker, management can do Trend analysis on their data easily and generate quicker reports. |
| T-SQL language used for query | MDX is used for querying on OLAP Cube |
Basic Architecture
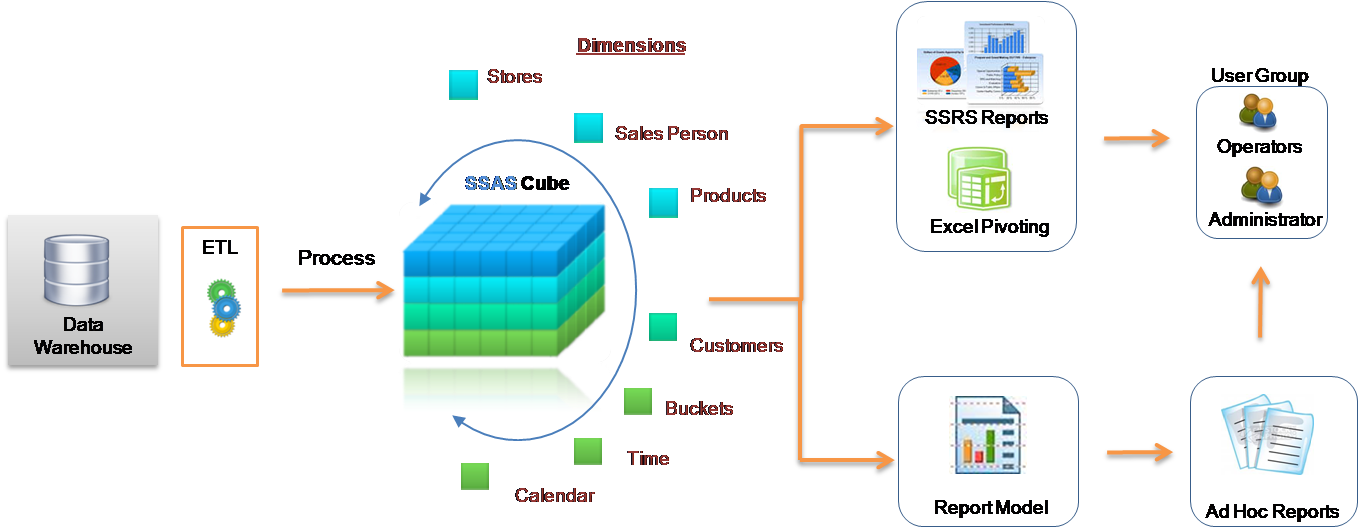
In our case, data warehouse is used as a source of data to Cube in BIDS. Once Cube gets ready with data, users can run queries on Cube created in SSAS. SSRS Reports and Excel Pivoting/Power Pivot can use OLAP Cube as source of data instead of OLTP database to get performance for resolving Complex Queries.
SSRS Reports, Excel Power Pivot can be used for visualization/analysis of data from cube.
Scenario
X-Mart is having different malls in our city, where daily sales take place for various products. Higher management is facing an issue while decision making due to non availability of integrated data they can’t do study on their data as per their requirement. So they asked us to design a system which can help them quickly in decision making and provide Return on Investment (ROI).
So as a part of the design, we had completed designing of First Data Warehouse in my previous article. Now we have to Design / Create OLAP Cube in SSAS, on which our reports can do a quick query and we can also provide self service BI capability to users later on.
Creating Data Warehouse
Let us execute our T-SQL Script to create data warehouse with fact tables, dimensions and populate them with appropriate test values.
Download T-SQL script attached with this article for creation of Sales Data Warehouse or download from this article “Create First Data Warehouse” and run it in your SQL Server.
Follow the given steps to run the query in SSMS (SQL Server Management Studio).
- Open SQL Server Management Studio 2008
- Connect Database Engine
- Open New Query editor
- Copy paste Scripts given below in various steps in new query editor window one by one
- To run the given SQL Script, press F5
- It will create and populate “
Sales_DW” database on your SQL Server
Developing an OLAP Cube
For creation of OLAP Cube in Microsoft BIDS Environment, follow the 10 easy steps given below.
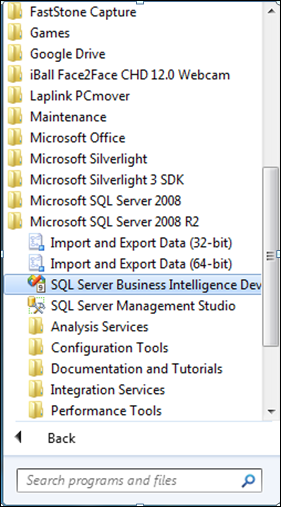
Step 1: Start BIDS Environment
Click on Start Menu -> Microsoft SQL Server 2008 R2 -> Click SQL Server Business Intelligence Development Studio.
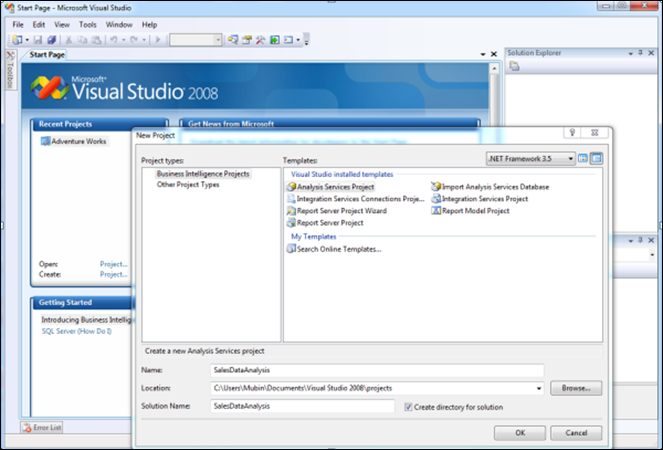
Step 2: Start Analysis Services Project
Click File -> New -> Project ->Business Intelligence Projects ->select Analysis Services Project-> Assign Project Name -> Click OK
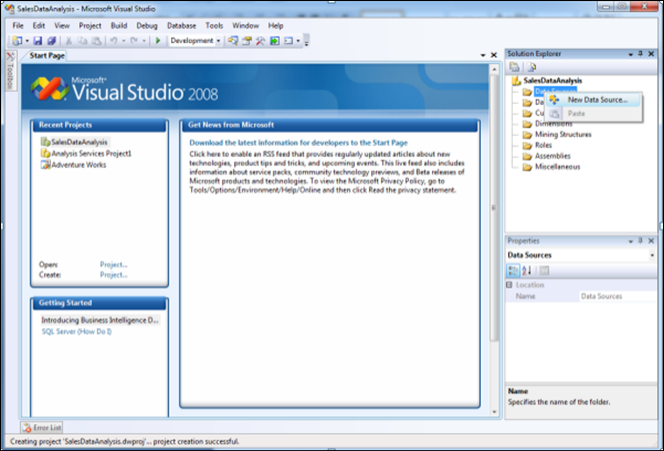
Step 3: Creating New Data Source
3.1 In Solution Explorer, Right click on Data Source -> Click New Data Source
3.2 Click on Next
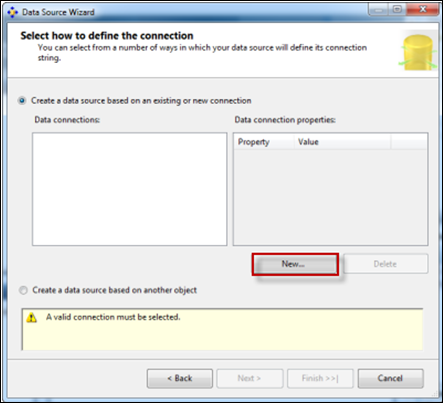
3.3 Click on New Button
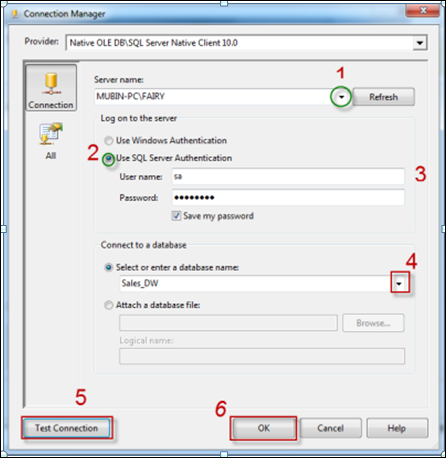
3.4 Creating New connection
- Specify Your SQL Server Name where your Data Warehouse was created
- Select Radio Button according to your SQL Server Authentication mode
- Specify your Credentials using which you can connect to your SQL Server
- Select database
Sales_DW. - Click on Test Connection and verify for its success
- Click OK.
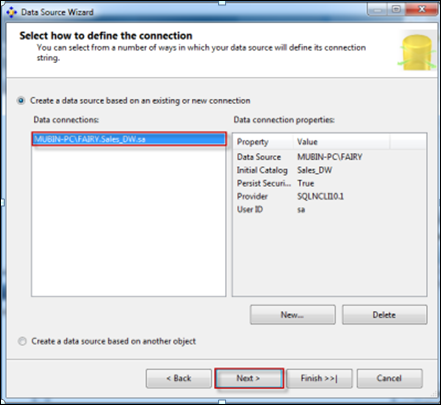
3.5 Select Connection created in Data Connections-> Click Next
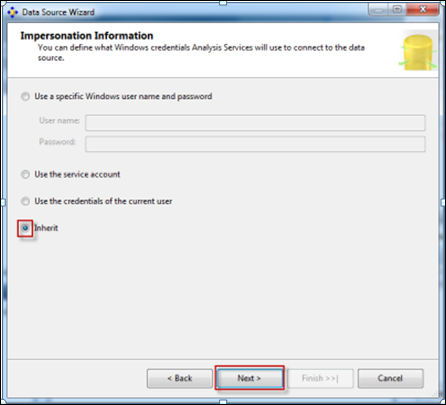
3.6 Select Option Inherit
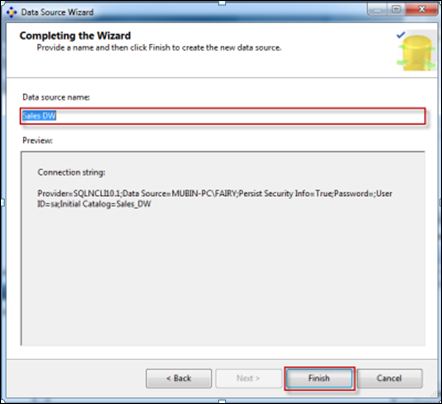
3.7 Assign Data Source Name -> Click Finish
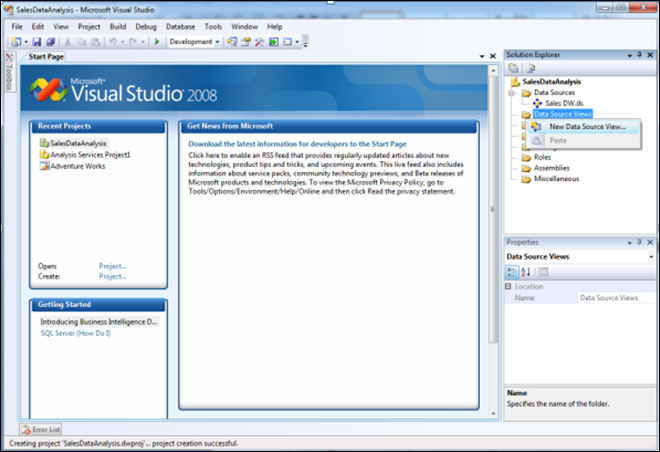
Step 4: Creating New Data Source View
4.1 In the Solution Explorer, Right Click on Data Source View -> Click on New Data Source View
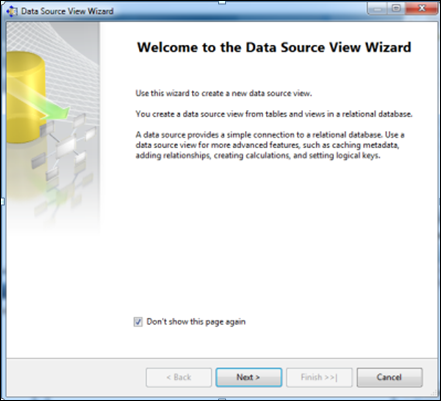
4.2 Click Next
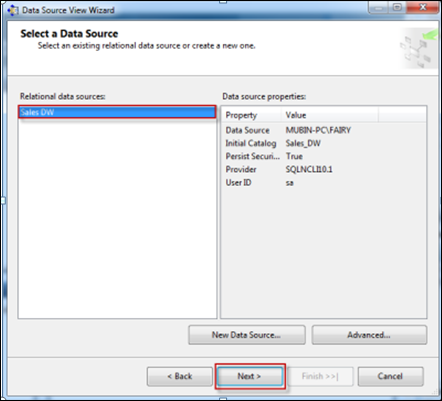
4.3 Select Relational Data Source we have created previously (Sales_DW)-> Click Next
4.4 First move your Fact Table to the right side to include in object list.
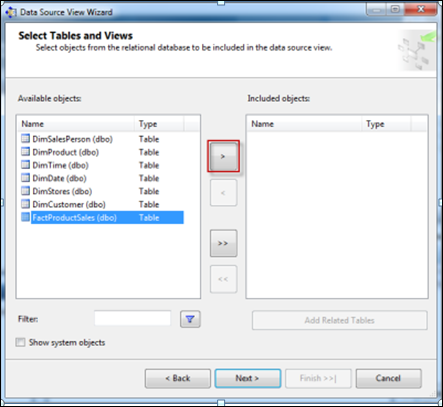
Select FactProductSales Table -> Click on Arrow Button to move the selected object to Right Pane.
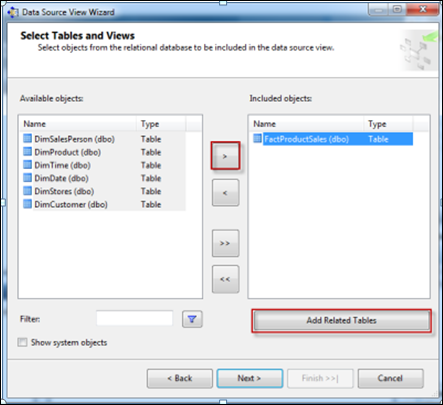
4.5 Now to add dimensions which are related to your Fact Table, follow the given steps:
Select Fact Table in Right Pane (Fact product Sales) -> Click On Add Related Tables
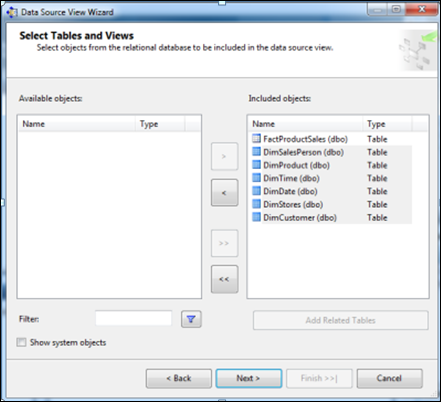
4.6 It will add all associated dimensions to your Fact table as per relationship specified in your SQL DW (Sales_DW).
Click Next.
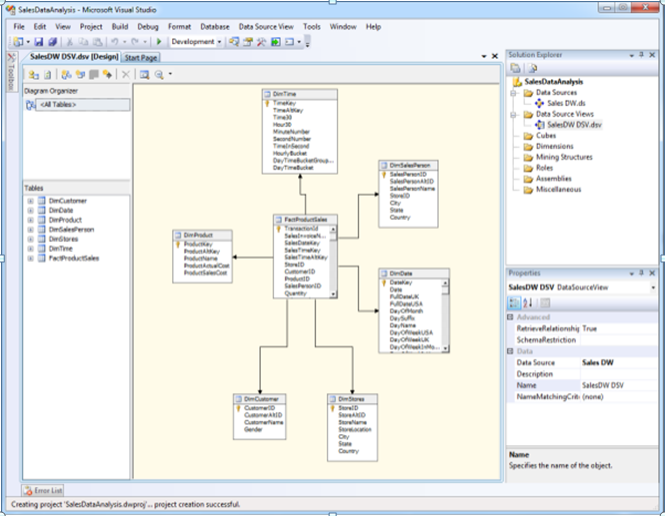
4.7 Assign Name (SalesDW DSV)-> Click Finish
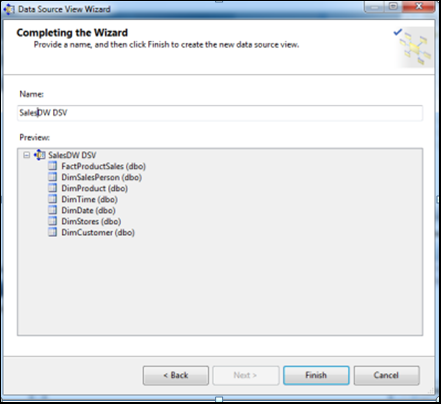
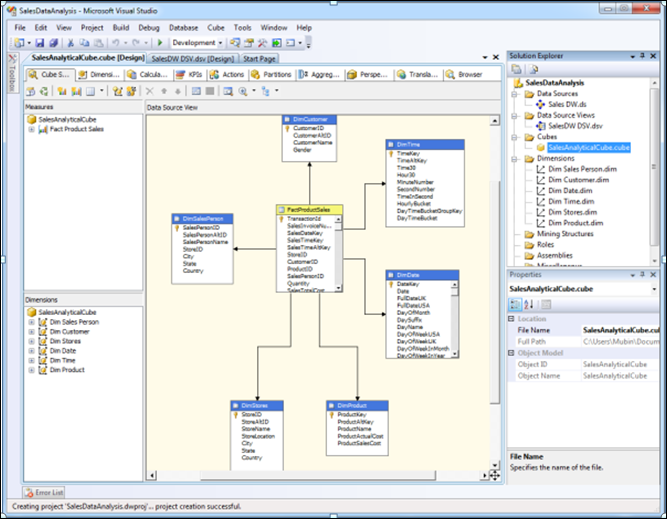
4.8 Now Data Source View is ready to use.
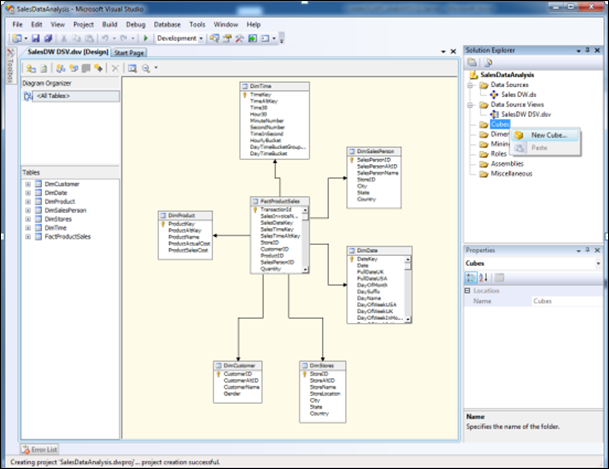
Step 5: Creating New Cube
5.1 In Solution Explorer -> Right Click on Cube-> Click New Cube
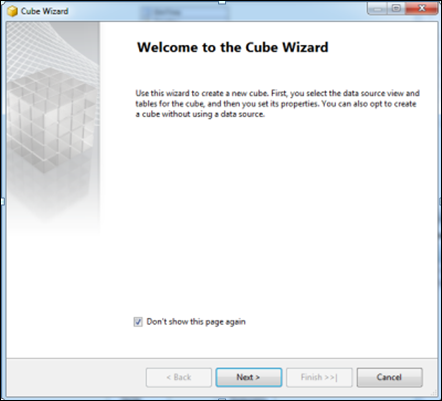
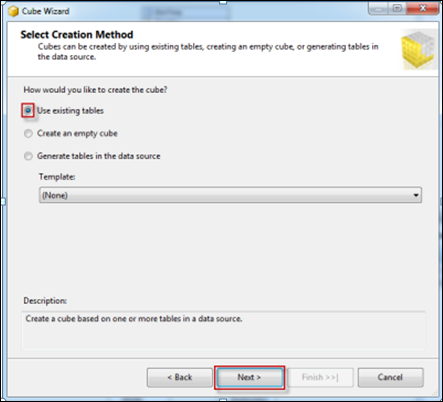
5.2 Click Next
5.3 Select Option Use existing Tables -> Click Next
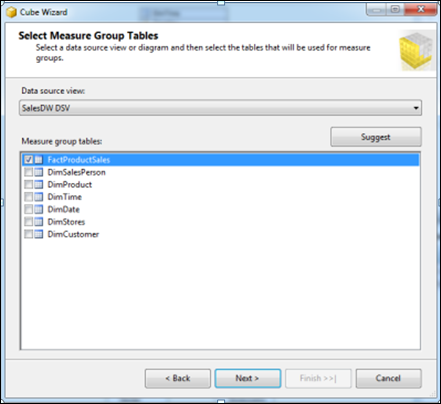
5.4 Select Fact Table Name from Measure Group Tables (FactProductSales) -> Click Next
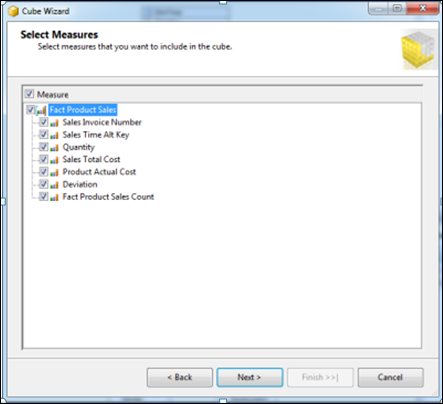
5.5 Choose Measures from the List which you want to place in your Cube --> Click Next
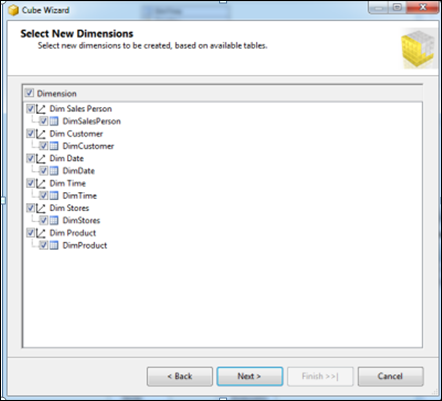
5.6 Select All Dimensions here which are associated with your Fact Table-> Click Next
5.7 Assign Cube Name (SalesAnalyticalCube) -> Click Finish
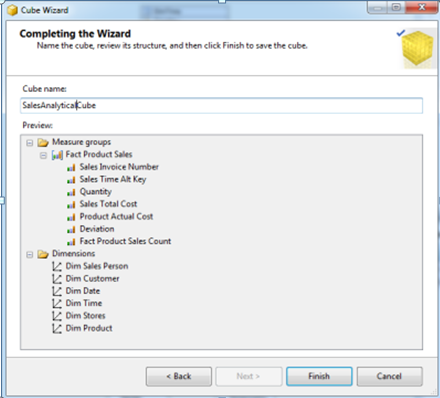
5.8 Now your Cube is ready, you can see the newly created cube and dimensions added in your solution explorer.
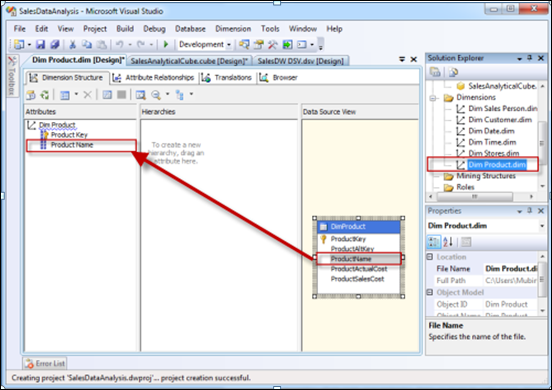
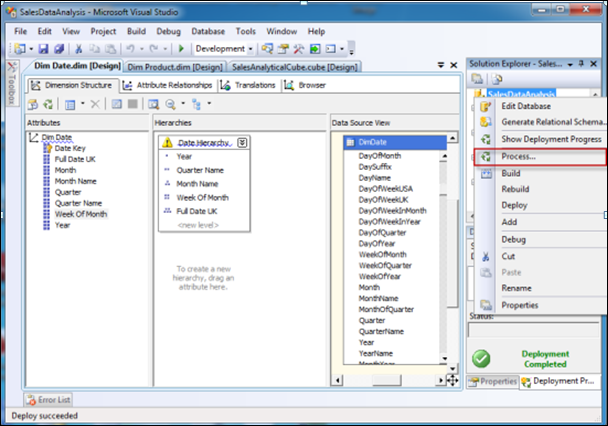
Step 6: Dimension Modification
In Solution Explorer, double click on dimension Dim Product -> Drag and Drop Product Name from Table in Data Source View and Add in Attribute Pane at left side.
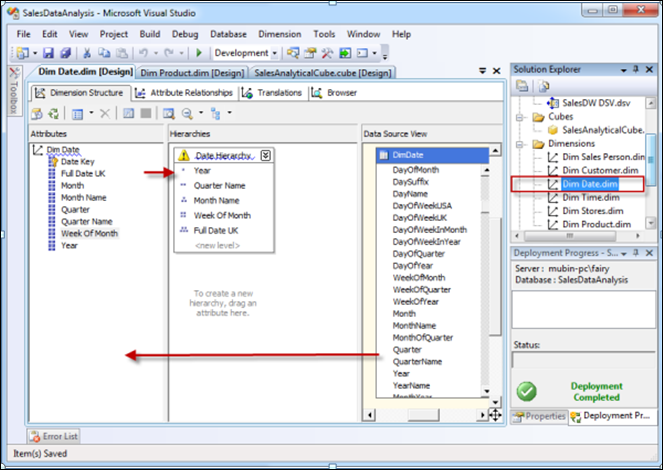
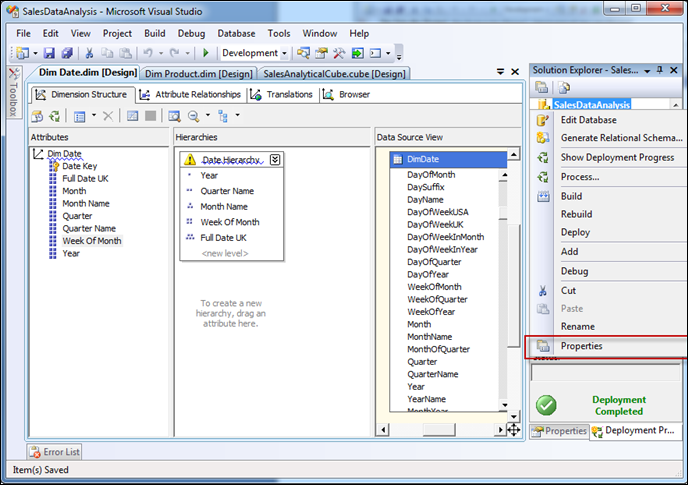
Step 7: Creating Attribute Hierarchy In Date Dimension
Double click On Dim Date dimension -> Drag and Drop Fields from Table shown in Data Source View to Attributes-> Drag and Drop attributes from leftmost pane of attributes to middle pane of Hierarchy.
Drag fields in sequence from Attributes to Hierarchy window (Year, Quarter Name, Month Name, Week of the Month, Full Date UK),
Step 8: Deploy the Cube
8.1 In Solution Explorer, right click on Project Name (SalesDataAnalysis) -- > Click Properties
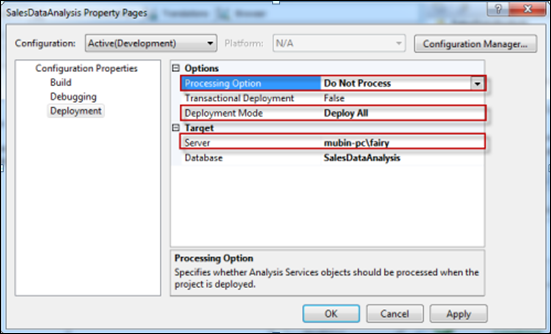
8.2 Set Deployment Properties First
In Configuration Properties, Select Deployment-> Assign Your SQL Server Instance Name Where Analysis Services Is Installed (mubin-pc\fairy) (Machine Name\Instance Name) -> Choose Deployment Mode Deploy All as of now ->Select Processing Option Do Not Process -> Click OK
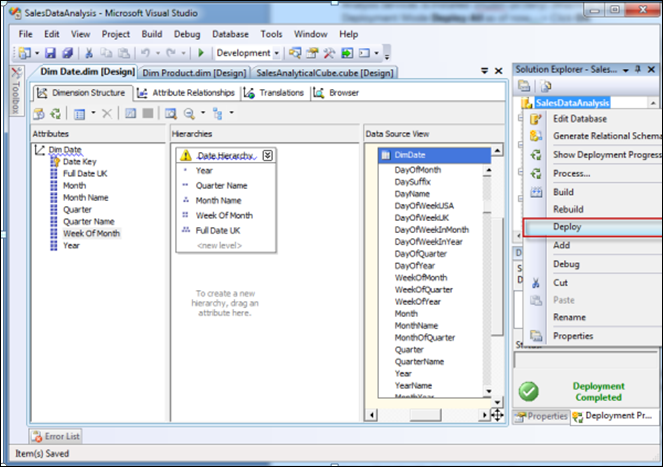
8.3 In Solution Explorer, right click on Project Name (SalesDataAnalysis) -- > Click Deploy
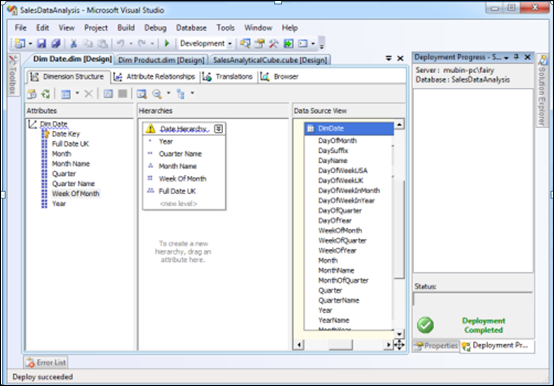
8.4 Once Deployment will finish, you can see the message Deployment Completed in deployment Properties.
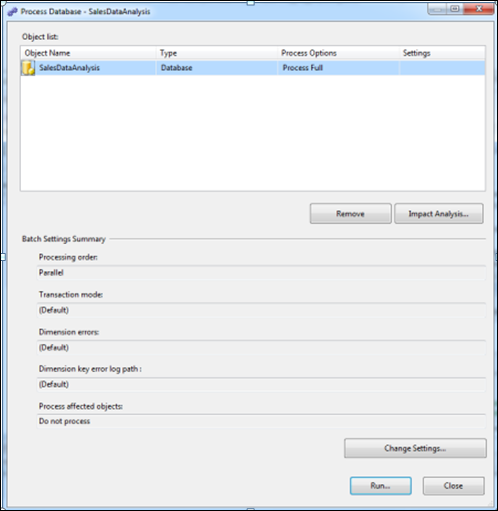
Step 9: Process the Cube
9.1 In Solution Explorer, right click on Project Name (SalesDataAnalysis) -- > Click Process
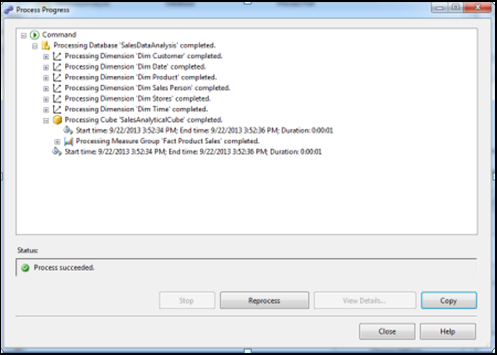
9.2 Click on Run button to process the Cube
9.3 Once processing is complete, you can see Status as Process Succeeded -->Click Close to close both the open windows for processing one after the other.
Step 10: Browse the Cube for Analysis
10.1 In Solution Explorer, right click on Cube Name (SalesDataAnalysisCube) -- > Click Browse
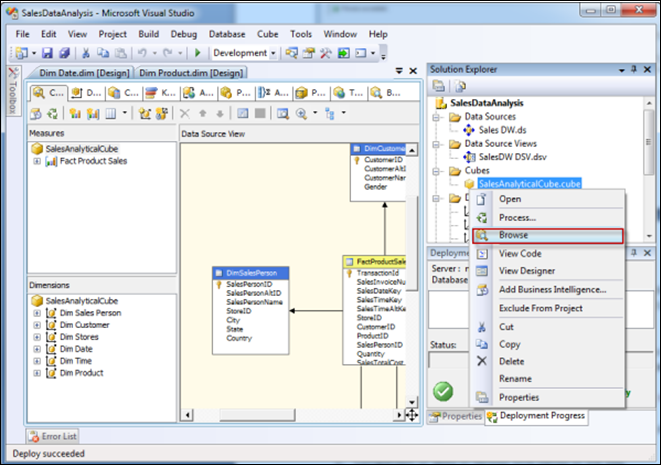
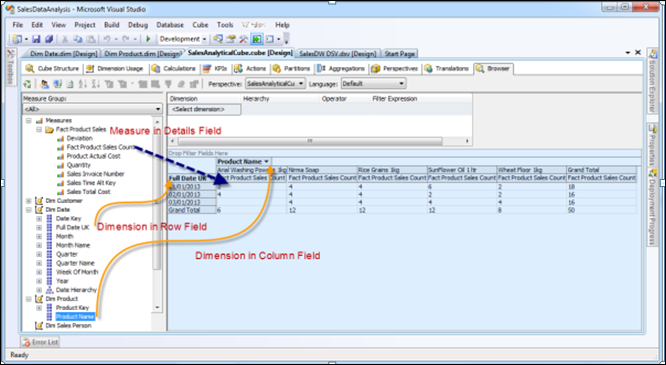
10.2 Drag and drop measures in to Detail fields, & Drag and Drop Dimension Attributes in Row Field or Column fields.
Now to Browse Our Cube
- Product Name Drag & Drop into Column
- Full Date UK Drag & Drop into Row Field
FactProductSalesCountDrop this measure in Detail area
We will see some more features shortly - how can we assign user friendly names, named calculations, named query, ordering on hierarchy, hiding dimension attributes, creating perspective, KPI, security roles, etc.